iPhoneアプリで棒グラフを描く方法として考えられるのは次の3通り。
ライブラリを使う - Charts というライブラリがある。おそらくこれが一般的な選択肢。 Viewを棒グラフに見立てる - UIStackViewをうまく使った例にこんなの がある。 CoreGraphicsを使って手で描画する - 厳密にはUIKit側でこれを扱いやすくしたものがあるみたいで、Drawing としてまとめられている。 ここではCoreGraphicsの練習を兼ねて、3つ目の方法で棒グラフを書いてみる。
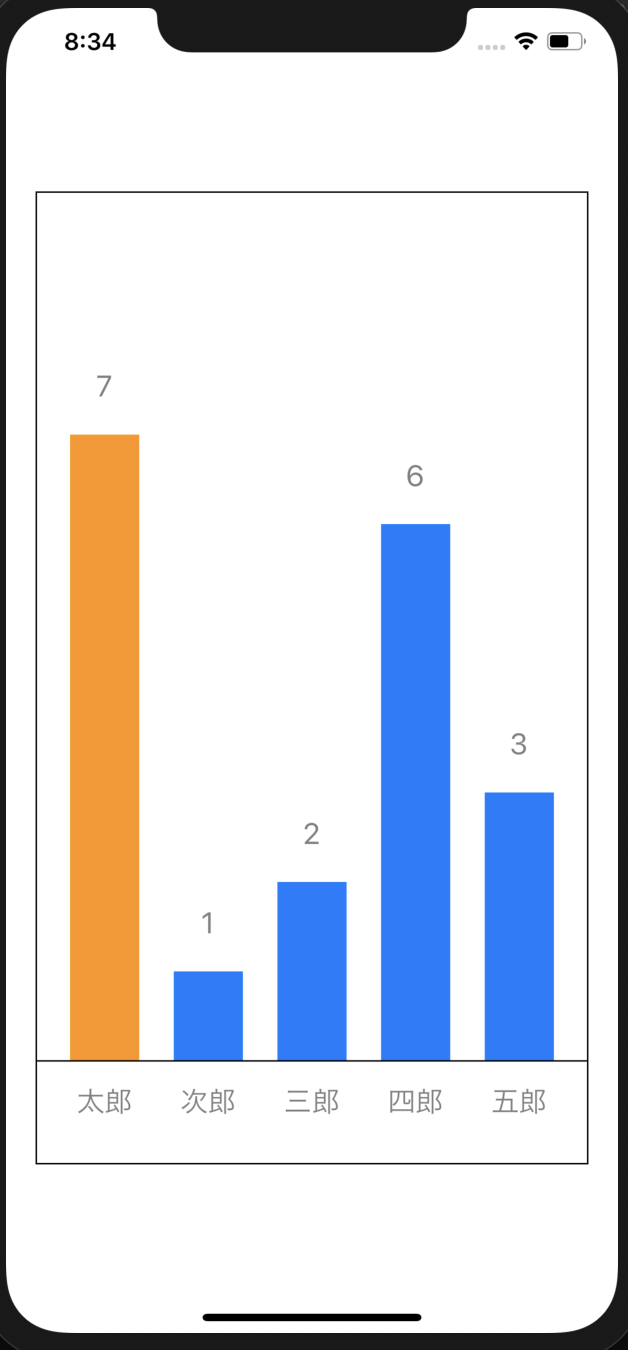
棒グラフを表示する 棒グラフの先端に値を表示する 今回用いるデータは(ラベル, 整数値)とする 整数値を棒グラフの高さとし、棒グラフの頂点にその数字を描く ラベルは棒グラフの下に描く 整数値が最も大きなものの色をオレンジ色にする 画面の大きさに関わらない図を作る 要するに以下のようなものを作る。
細かいレイアウト# 画面の大きさに応じて棒グラフのサイズを変更する必要があるため、レイアウトについてそれなりに決めておく。テキストについては適当なサイズに設定する。
ビューの幅を$W$、barWidthを$w$、データの個数を$n$とする。するとpadXの個数は$n+1$である。このとから、$w$は次のように計算できる。
$$
\begin{aligned}
& wn + \frac{w}{2}(n+1) = W \\
\Leftrightarrow&\ w = \frac{2W}{3n + 1}
\end{aligned}
$$
この計算結果をbarWidthとして利用する。
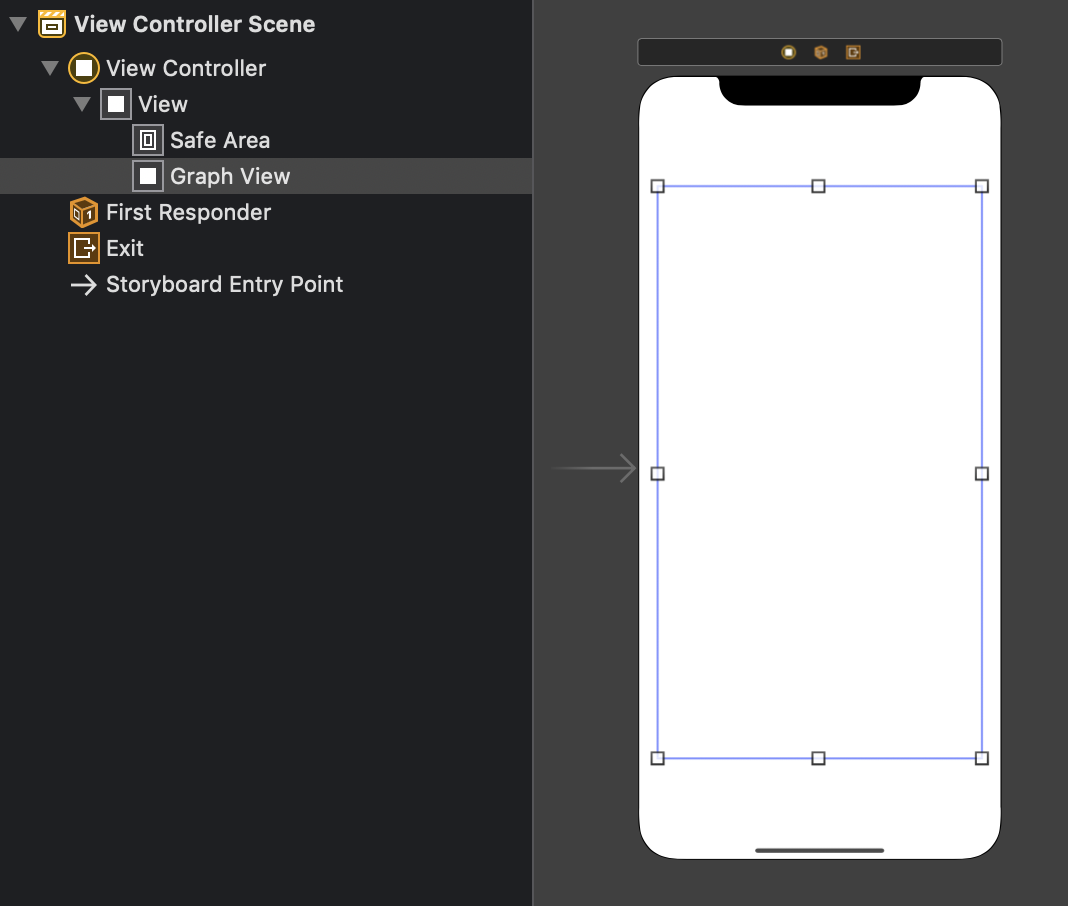
Main.storyboardを次のようにしておく。
GraphViewのClassをGraphViewにする。新たにGraphView.swiftを作っておく。
GraphView.swiftを作る# 以下が雛形。
 1
 2
 3
 4
 5
 6
 7
 8
 9
10
class GraphView : UIView {
override func awakeFromNib () {
}
let data : [( String , CGFloat )] = [( 7 , "太郎" ), ( 1 , "次郎" ), ( 2 , "三郎" ), ( 6 , "四郎" ), ( 3 , "五郎" )]
override func draw ( _ rect : CGRect ) {
}
}
Viewの枠線# layer.borderWidthとlayer.borderColorで枠線を設定できる。これはCoreGraphicsとは関係ない。
1
2
3
4
override func awakeFromNib () {
layer . borderWidth = 1.0
layer . borderColor = UIColor . black . cgColor
}
各種定数の設定# 作ったレイアウトを元に定数を定義しておく。
 1
 2
 3
 4
 5
 6
 7
 8
 9
10
11
12
13
14
override func draw ( _ rect : CGRect ) {
let barWidth : CGFloat = {
let numer : CGFloat = 2 * rect . size . width
let denom : CGFloat = 3 * CGFloat ( data . count ) + 1
return numer / denom
}()
let padX : CGFloat = barWidth / 2
let padY : CGFloat = rect . size . height / 4
let textAreaHeight : CGFloat = 70
guard let dataMax = ( data . map { $0 . 0 }. max ()) else {
print ( "Failed to get data.max()" )
return
}
}
棒グラフ描画# GraphicContext取得# strokeとかfillとかの、描画に関する諸々の設定を行うためには、GraphicContextを取得する。
1
2
3
4
5
6
7
override func draw ( _ rect : CGRect ) {
...
guard let context = UIGraphicsGetCurrentContext () else {
print ( "Failed to get context" )
return
}
}
適切な座標を取得する関数# 描画の座標系は左上から右下が正の方向。しかし、左下から右上に向かって伸びる棒グラフにしたいので、何番目の棒グラフがどの位置で、どんな長さなのかを計算する必要がある。これをできるだけ簡単に行うための関数を定義する。
scaleLinear# D3.jsでお馴染み。ある定義域からある値域への一次関数を作る関数。
1
2
3
4
5
6
7
8
// ran[1] - ran[0]
// f(x) = ----------------- * (x - dom[0]) + ran[0]
// dom[1] - dom[0]
func scaleLinear ( domain dom : ( CGFloat , CGFloat ), range ran : ( CGFloat , CGFloat )) -> (( CGFloat ) -> CGFloat ) {
return { ( x : CGFloat ) -> CGFloat in
( ran . 1 - ran . 0 ) / ( dom . 1 - dom . 0 ) * ( x - dom . 0 ) + ran . 0 ;
}
}
これを利用してxScale、yScale、hScaleを定義する。
xScale: 配列のindexから、棒グラフのx座標を算出してくれる関数yScale: 配列の値から、棒グラフのy座標を算出してくれる関数hScale: 配列の値から、棒グラフの高さを算出してくれる関数1
2
3
4
5
6
override func draw ( _ rect : CGRect ) {
...
let xScale = scaleLinear ( domain : ( 0 , CGFloat ( data . count )), range : ( padX , rect . width ))
let yScale = scaleLinear ( domain : ( 0 , valueMax ), range : ( rect . height - textAreaHeight , padY ))
let hScale = scaleLinear ( domain : ( 0 , valueMax ), range : ( 0 , rect . height - padY - textAreaHeight ))
}
棒グラフ描画# ここからはfor文を使って各要素ごとに処理する。もしvalが最大値だったらfillをオレンジに、そうでなければ青に設定する。
1
2
3
4
5
6
7
8
9
10
11
override func draw ( _ rect : CGRect ) {
...
for ( i , datum ) in data . enumerated () {
let ( val , name ) = datum
if val == valueMax {
context . setFillColor ( UIColor . systemOrange . cgColor )
} else {
context . setFillColor ( UIColor . systemBlue . cgColor )
}
}
}
実際の棒グラフの描画にはUIBezierPath.fill()を使う。このUIBezierPathは、矩形を描いたりベジェ曲線を描いたり、円弧を描いたりなど、様々な使い方ができる。
 1
 2
 3
 4
 5
 6
 7
 8
 9
10
11
12
override func draw ( _ rect : CGRect ) {
...
for ( i , datum ) in data . enumerated () {
...
let drawRect = UIBezierPath ( rect : CGRect (
x : xScale ( CGFloat ( i )),
y : yScale ( val ),
width : barWidth ,
height : hScale ( val )))
drawRect . fill ()
}
}
for文の直後に、横軸を描画するコードを書く。
1
2
3
4
5
6
7
8
9
10
11
override func draw ( _ rect : CGRect ) {
...
for ( i , datum ) in data . enumerated () {
...
}
context . setStrokeColor ( UIColor . black . cgColor )
let drawAxisBottom = UIBezierPath ()
drawAxisBottom . move ( to : CGPoint ( x : 0 , y : yScale ( 0 )))
drawAxisBottom . addLine ( to : CGPoint ( x : rect . size . width , y : yScale ( 0 )))
drawAxisBottom . stroke ()
}
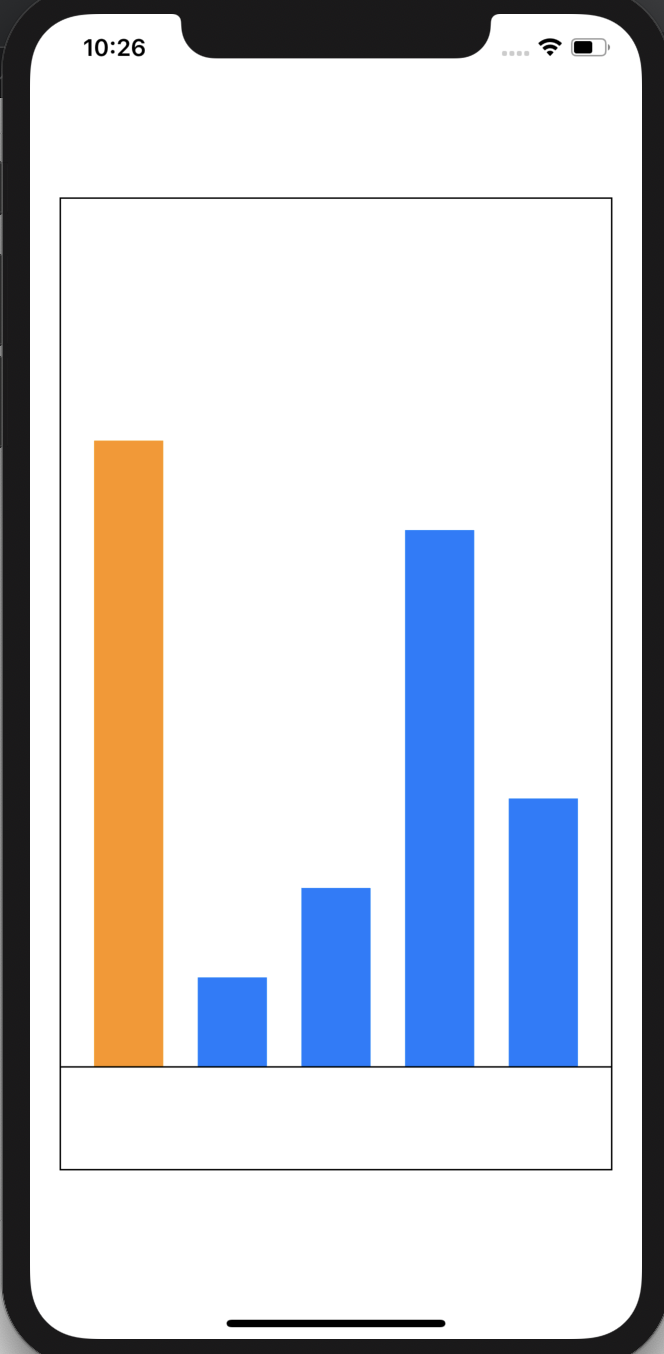
この時点で、次のように描画される。
テキスト# 定数の設定# 描画するテキストの設定はtextFontAttributesにDictionaryとしてまとめておく。今回は次の設定を行なっている。
フォントファミリーはSystemFont 中央寄せにする 色は灰色 テキストの枠は90pt×30pt これらはtext描画の際の引数に指定する。
 1
 2
 3
 4
 5
 6
 7
 8
 9
10
11
12
13
14
15
16
override func draw ( _ rect : CGRect ) {
...
let font = UIFont . systemFont ( ofSize : 20 )
let textStyle = NSMutableParagraphStyle ()
textStyle . alignment = . center
let textFontAttributes = [ NSAttributedString . Key . font : font ,
NSAttributedString . Key . paragraphStyle : textStyle ,
NSAttributedString . Key . foregroundColor : UIColor . gray ]
let textWidth : CGFloat = 90
let textHeight : CGFloat = 30
guard let context = UIGraphicsGetCurrentContext () else {
...
}
...
}
名前の描画# テキストの位置、サイズをCGRectとして用意し、表示するテキストと、前で定義したtextFontAttributesを用意する。
 1
 2
 3
 4
 5
 6
 7
 8
 9
10
11
for ( i , datum ) in data . enumerated {
...
let titleTextRect = CGRect (
x : xScale ( CGFloat ( i )) + barWidth / 2 - textWidth / 2 ,
y : yScale ( 0 ) + textHeight / 2 ,
width : textWidth ,
height : textHeight
)
let titleText = name
titleText . draw ( in : titleTextRect , withAttributes : textFontAttributes )
}
数値の描画# やってることは上とまったく同じ。
 1
 2
 3
 4
 5
 6
 7
 8
 9
10
11
12
for ( i , datum ) in data . enumerated {
...
let valueTextRect = CGRect (
x : xScale ( CGFloat ( i )) + barWidth / 2 - textWidth / 2 ,
y : yScale ( val ) - 3 * textHeight / 2 ,
width : textWidth ,
height : textHeight
)
let dataInt = Int ( val )
let valueText = " \( dataInt ) "
valueText . draw ( in : valueTextRect , withAttributes : textFontAttributes )
}
ということで、目的のものができた。
(次回) 横スクロールできるようにする# 画像サイズの大きさに応じて棒グラフが自動伸縮するのはありがたいが、データ数が多くなってくるとやはり見辛い。
そこで、GraphViewを複数用意して、UIScrollViewを使ってページを横スクロールできるようにする。
これをなるべく楽にやるためには、今のコードを大幅改変しなければならない。長くなるため次の記事にする。